UpCloud: Getting Historical Load Balancer Metrics using Grafana & SQLite
Update!!! This is now avaiable via UpCloud’s dashboard!
Prerequisites
Requirements for this to work:
- Access to UpCloud’s API.
- UpCloud’s Managed Load Balancer.
- Grafana & the SQLite plugin (the data source).
- SQLite database.
- Python 3 & Pip3.
- An Ubuntu 22.04 server.
So why is this useful? As of September 2023, UpCloud only shows the latest load balancer metrics on their control panel. API queries also only return the latest value at the time the query is run. This does not really help you to troubleshoot if you do not have a good understanding of what your baseline is, so what can we do? We can call the API and save the JSON response to a database, then query the database over time to see how the values fluctuate.
This guide is meant for an Ubuntu 22.04 server and a load balancer configuration that has: one frontend and two or more backends. Personal testing was done on one frontend and two backends.
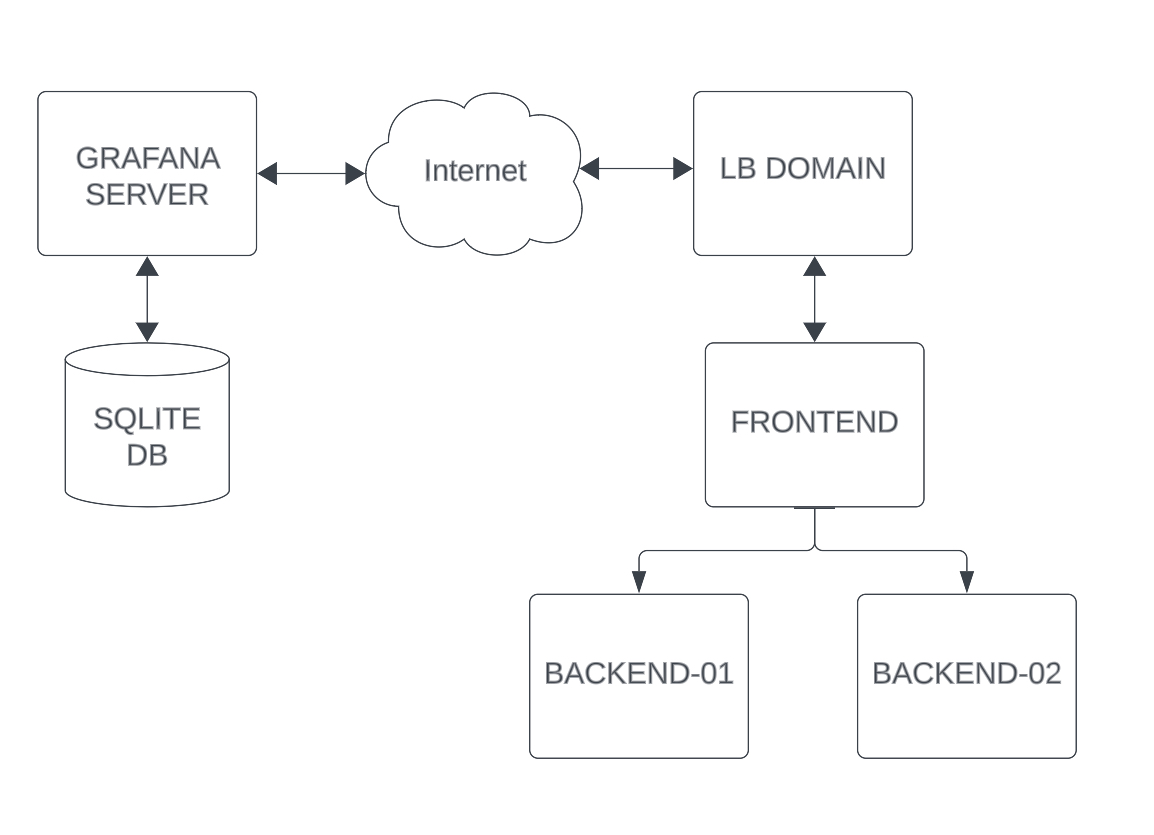
Architectural Chart
NOTE: You may need to modify the code below should you choose to have multiple frontends. You must change the frontend code as lists and nested schema for the frontend and backend members are not allowed in SQLite and will cause errors.
Setting up an UpCloud Load Balancer Subaccount
Navigate to People > Create subaccount.

Create a new subaccount. Do not enable 2FA or else API access will break!
Now lets secure the subaccount a little…
Go to the subaccount user’s Permissions page and allow API connections, then toggle off all other permissions. After that is done, navigate to the Load Balancers permissions and Add the Load Balancer you want the subaccount to be able to query. Block all other permissions .
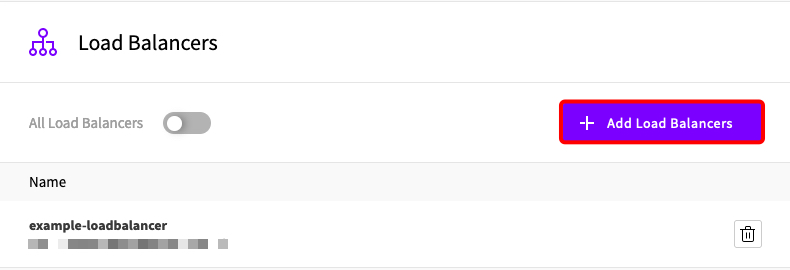
I will assume you know how to create an Ubuntu 22.04 server on UpCloud and already have a load balancer setup so I will skip these steps.
- If you don’t know how to create a server, then refer to their tutorial here.
- If you don’t know how to create a load balancer, then refer to their tutorial here.
Installing and Configuring SQLite
So why SQLite instead of something else? In my opinion SQLite is easy to understand and simple enough for beginners. Grafana uses SQLite itself but the choice of databases is arbitrary, any database will work for this.
If you have another database you want to use then refer to the SQLAlchemy documentation on supported databases and how to connect to the database. Then modify the python code below to reflect your changes.
Let’s begin.
1sudo apt-get update && sudo apt-get install sqlite3 -y
Create the SQLite database. Try to save it in another directory other than the home directory as Grafana will attempt to protect files in that directory. If you can’t then I will show you how to override this behavior in the following sections.
1sqlite3 /home/lb-metrics.db
We are calling the database lb-metrics.db for this example but the name can be anything.
Create and format the database tables to put the JSON API responses into. This is very simple as all we need to do is to create a table for each level of the JSON response. If you are missing a column then there will be an error when you run the script as it cannot write the data to the corresponding column.
 1CREATE TABLE frontends (
 2    id INTEGER PRIMARY KEY AUTOINCREMENT,
 3    created_at TEXT,
 4    current_sessions INTEGER,
 5    name TEXT,
 6    request_rate INTEGER,
 7    session_rate INTEGER,
 8    total_denied_requests INTEGER,
 9    total_http_requests INTEGER,
10    total_http_responses_1xx INTEGER,
11    total_http_responses_2xx INTEGER,
12    total_http_responses_3xx INTEGER,
13    total_http_responses_4xx INTEGER,
14    total_http_responses_5xx INTEGER,
15    total_http_responses_other INTEGER,
16    total_invalid_requests INTEGER,
17    total_request_bytes INTEGER,
18    total_response_bytes INTEGER,
19    total_sessions INTEGER,
20    updated_at TEXT
21);
22CREATE TABLE backends (
23    id INTEGER PRIMARY KEY AUTOINCREMENT,
24    avg_connection_time_ms INTEGER,
25    avg_queue_time_ms INTEGER,
26    avg_server_response_time_ms INTEGER,
27    avg_total_time_ms INTEGER,
28    connections_waiting INTEGER,
29    created_at TEXT,
30    current_sessions INTEGER,
31    name TEXT,
32    session_rate INTEGER,
33    total_client_aborted INTEGER,
34    total_failed_checks_transitions INTEGER,
35    total_failed_connections INTEGER,
36    total_http_responses_1xx INTEGER,
37    total_http_responses_2xx INTEGER,
38    total_http_responses_3xx INTEGER,
39    total_http_responses_4xx INTEGER,
40    total_http_responses_5xx INTEGER,
41    total_http_responses_other INTEGER,
42    total_invalid_responses INTEGER,
43    total_request_bytes INTEGER,
44    total_response_bytes INTEGER,
45    total_server_aborted INTEGER,
46    total_server_connection_retries INTEGER,
47    total_sessions INTEGER,
48    updated_at TEXT
49);
50CREATE TABLE members (
51    id INTEGER PRIMARY KEY AUTOINCREMENT,
52    backend_name TEXT, -- Use the "backend_name" column to store the parent backend name
53    name TEXT,
54    avg_connection_time_ms INTEGER,
55    avg_queue_time_ms INTEGER,
56    avg_server_response_time_ms INTEGER,
57    avg_total_time_ms INTEGER,
58    check_http_code INTEGER,
59    check_status TEXT,
60    connections_waiting INTEGER,
61    created_at TEXT,
62    current_sessions INTEGER,
63    session_rate INTEGER,
64    status TEXT,
65    total_client_aborted INTEGER,
66    total_failed_checks INTEGER,
67    total_failed_checks_transitions INTEGER,
68    total_failed_connections INTEGER,
69    total_http_responses_1xx INTEGER,
70    total_http_responses_2xx INTEGER,
71    total_http_responses_3xx INTEGER,
72    total_http_responses_4xx INTEGER,
73    total_http_responses_5xx INTEGER,
74    total_http_responses_other INTEGER,
75    total_invalid_responses INTEGER,
76    total_request_bytes INTEGER,
77    total_response_bytes INTEGER,
78    total_server_aborted INTEGER,
79    total_server_connection_retries INTEGER,
80    total_sessions INTEGER,
81    updated_at TEXT,
82    FOREIGN KEY (backend_name) REFERENCES backends (name)
83);
NOTE: The tables frontends and backends are cumulative for the entire load balancer. The members table is a more granular look at the individual backend server (or if configured) frontend members.
Check that the tables were created successfully.
1.schema
Exit the database.
1.exit
Cool fact! 24 hours of logs is ~500kB of disk storage.
Setup the Python Script
Update your repositories and install python3 and pip3.
1sudo apt-get update && sudo apt-get install python3 python-pip3 -y
Install the required python libraries
1pip3 install requests pandas sqlalchemy
Create a file called lb-metrics.py and add this code to it. Remember to update the lb_uuid, username, and password variables.
 1import requests
 2import pandas as pd
 3import sqlalchemy
 4
 5df = pd.DataFrame()
 6
 7lb_uuid = "YOUR-LOAD-BALANCER-UUID"
 8username = "YOUR-API-USER-USERNAME"
 9password = "YOUR-API-USER-PASSWORD"
10url = "https://api.upcloud.com/1.3/load-balancer/{}/metrics".format(lb_uuid)
11# This is the absolute path to /home/lb-metrics.db
12engine = sqlalchemy.create_engine("sqlite:////home/lb-metrics.db")
13
14# Make a request to the API
15response = requests.get(url, auth=(username, password))
16
17# Check if the API request was successful
18if response.status_code == 200:
19    data = response.json()
20
21    # Verify if "frontends" data exists in the JSON response
22    if "frontends" in data:
23        # Extract and process "frontends" data
24        frontends_data = data["frontends"]
25
26        # Convert the "frontends" JSON data into a DataFrame
27        frontends_df = pd.DataFrame(frontends_data)
28
29        # Append the "frontends" DataFrame to the "frontends" table in the SQLite database
30        frontends_df.to_sql(name="frontends", index=False, con=engine, if_exists="append")
31
32        print("Data appended to 'frontends' table in SQLite database successfully.")
33    else:
34        print("No 'frontends' data found in the JSON response.")
35
36    # Verify if "backends" data exists in the JSON response
37    if "backends" in data:
38        # Extract and process "backends" data
39        backends_data = data["backends"]
40
41        # Create a DataFrame for backends without "members" data
42        backends_df = pd.DataFrame()
43
44        # Create a list to collect member data
45        members_list = []
46
47        # Process and collect member data
48        for index, backend_data in enumerate(backends_data):
49            # Create a copy of the backend data without "members"
50            backend_without_members = backend_data.copy()
51            backend_without_members.pop("members", None)
52
53            # Append the backend data to the backends DataFrame
54            backends_df = pd.concat([backends_df, pd.DataFrame([backend_without_members])], ignore_index=True)
55
56            # Process and collect member data if "members" exist
57            members_data = backend_data.get("members", [])
58            for member in members_data:
59                member_entry = {
60                    "backend_name": backend_data["name"],  # Add the parent backend name
61                    **member  # Add member data
62                }
63                members_list.append(member_entry)
64
65        # Create DataFrames for members
66        members_df = pd.DataFrame(members_list)
67
68        # Append the "backends" DataFrame to the "backends" table in the SQLite database
69        backends_df.to_sql(name="backends", index=False, con=engine, if_exists="append")
70
71        # Append the "members" DataFrame to the "members" table in the SQLite database
72        members_df.to_sql(name="members", index=False, con=engine, if_exists="append")
73
74        print("Data appended to 'backends' and 'members' tables in SQLite database successfully.")
75    else:
76        print("No 'backends' data found in the JSON response.")
77else:
78    print("API request failed with status code:", response.status_code)
Test that the python script is working and that no errors are being printed to the console.
1python3 lb-metrics.py
Verify that the script is writing the API responses to the SQLite database by connecting to the local database.
1sqlite3 lb-metrics.db
Then run this SQL to ensure everything is working as intended.
1SELECT * FROM members;
If you are successful then continue on to the next steps.
Note: In the code, four slashes (sqlite:////…) is used by SQLAlchemy for the absolute path to the database and three slashes for the relative path.
Again, if you have another database you want to use then refer to the SQLAlchemy documentation on supported databases and how to connect to the database. Then modify the python code above to reflect your changes.
Setup a Cronjob
Create a cronjob to run this code.
1crontab -e
Add this line to the crontab file. This will run the code every minute.
1* * * * * /bin/python3 /PATH/TO/YOUR/SCRIPT/lb-metrics.py >> out.txt 2>&1
We are also adding a file called out.txt which will print out what the script is doing. This is useful for troubleshooting any errors if the code is not working. By default the file will be written to the current users home directory: $HOME/out.txt. If you don’t want this file then leave out everything after the path to the script.py file.
Save and exit.
Check that the job was saved successfully.
1crontab -l
If you run into any errors and out.txt doesn’t help you narrow down the issue. I find that running the command in crontab helps.
1/bin/python3 /PATH/TO/YOUR/SCRIPT/lb-metrics.py
Setup Grafana
I will assume that you already have Grafana installed, if not then refer to their Ubuntu installation guide here. Refer to the best security practices here. Please ensure you keep your dashboard secure.
I use the SQLite plugin by Sergej Herbert. Link to their Github here.
Install the plugin via the command line.
1grafana-cli plugins install frser-sqlite-datasource
Restart Grafana.
1systemctl restart grafana-server
On your browser navigate to your server IP and port 3000.
Go to Connections > Data sources.
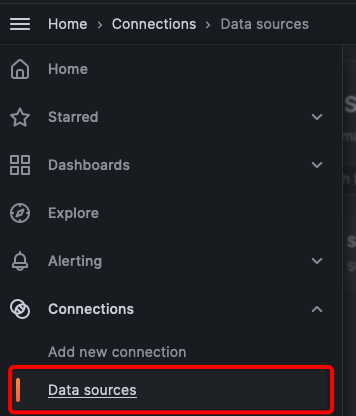
Then click on the Add data source button.

Search for SQLite.

Add the path to your database and click Save & Test. If successful, you should see this screen.
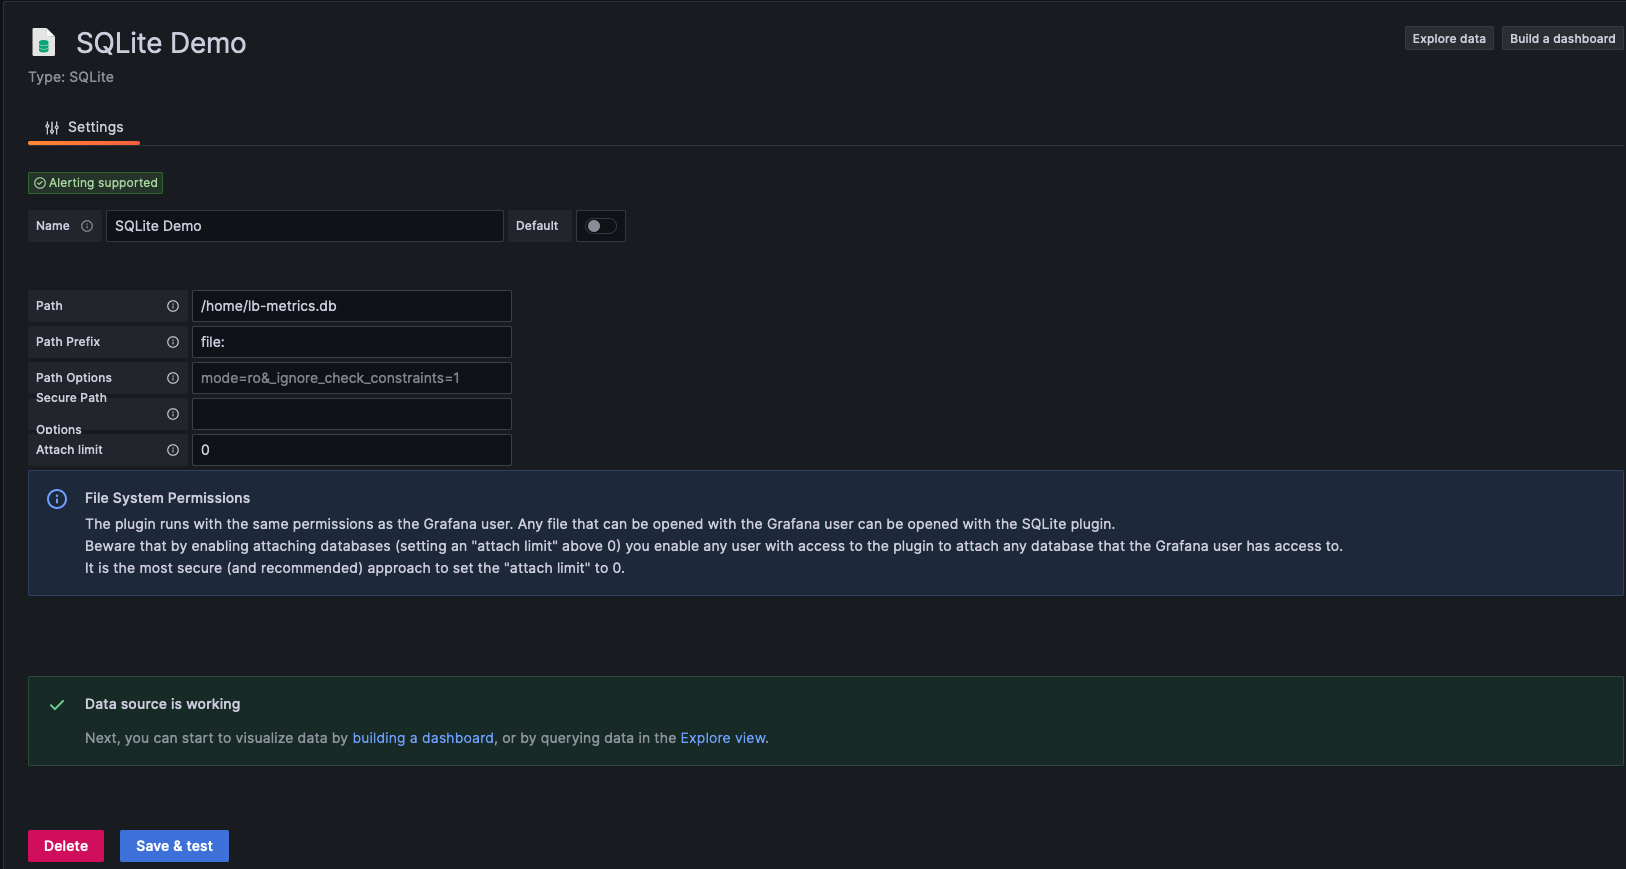
If not then you will need to fix the error and try again. Some common errors are “file not found” and “permission denied”. Refer to the SQLite plugin troubleshooting documentation.
Now let’s build a Dashboard…

Click on Add visualization and select your SQLite data source.
You will use the same SQL syntax as you do for SQLite. For example:
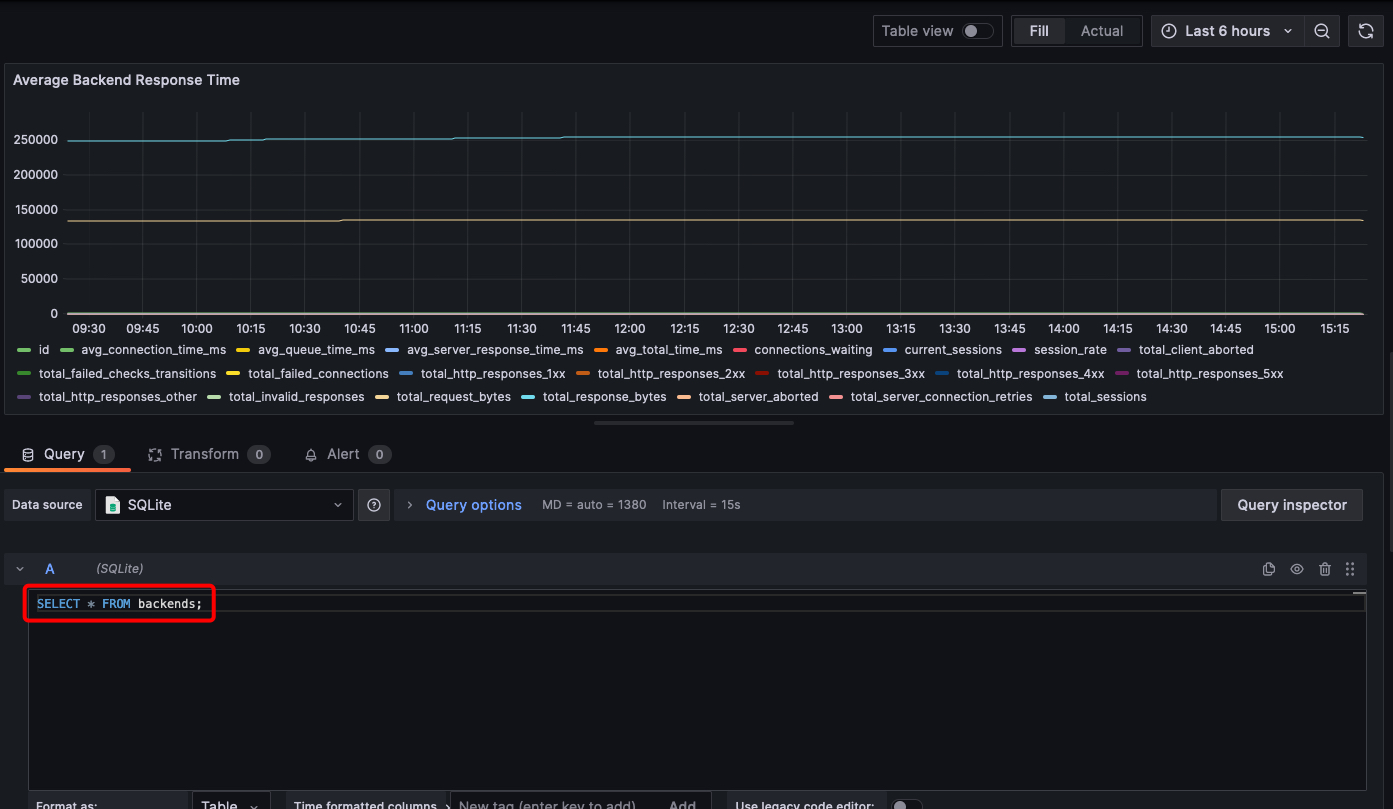
To enable monitoring over time, you need a column that should be used for time keeping. Set the updated_at column as the time formatted column here:

That’s it! Now you have a dashboard for monitoring your load balancer metrics! I hope you had fun! 🎉